

As we know that the web applications embed the JavaScript, CSS, and other dependencies in the HTML code, which renders in the web browser to show the final look and feel of the application. As HTML code is not compiled but is directly rendered in the browser, it becomes challenging for the developers to make the needed changes in the code files and then preview the browser changes. This raises the need for web browsers capability, which can enable the users to make the JavaScript, CSS, and HTML changes directly inside the browser. Even testers finding and inspecting an element in the browser has become a key term in automation testing. A web inspector or browser inspector helps identify the locators for the available elements on the web page, which we want to automate. In other words, it helps us to inspect elements.
Don't worry. This is not an additional software that you are required to install but comes inbuilt into the browsers. The web inspector is similar in Google Chrome, Internet Explorer and Firefox browser with slight changes in the names and features. Through the web developer tools, we can inspect elements in these browsers. In this article, we will focus on the following points to understand the usage of the web inspector in various modern browsers:
- What is a Web Inspector?
- How to inspect elements in a Web Browser?
- How to inspect elements in Google Chrome?
- Similarly, how to inspect elements in Firefox?
- How to inspect elements in Microsoft Edge?
- Also, how to inspect elements in Internet Explorer?
- How to manipulate Web Elements using Web Inspector?
- How to manipulate HTML attributes using Web Inspector?
- Also, how to manipulate CSS attributes using Web Inspector?
- How to manipulate JavaScript attributes using Web Inspector?
What is a Web Inspector?
As mentioned earlier, a web inspector or a browser inspector helps to identify/locate what's inside the web page in a browser. With the web inspector beside us, we can explore and manipulate the browser's code to see the screen's sudden changes. This is also popularly referred to as "inspecting an element". The inspector shows the CSS, HTML, and JavaScript of the web page so that the developer or the tester can analyze the web page and use the browser developer tools' features to run a few checks.
A good example is checking out the color of some text on the web page. If I try to change the color code on my text editor, save the file, refresh the web page again, and again, it becomes tedious. For this, I can change the color code within the browser through the web inspector on that particular line and see live on the web page. These changes done on the web inspector are temporary and will disappear once I close the tab. This makes the debugging very easy and live, where the user can directly update the attributes within the browser only. Hence, you can go wild and experiment with anything!!
How to Inspect Elements In a web browser?
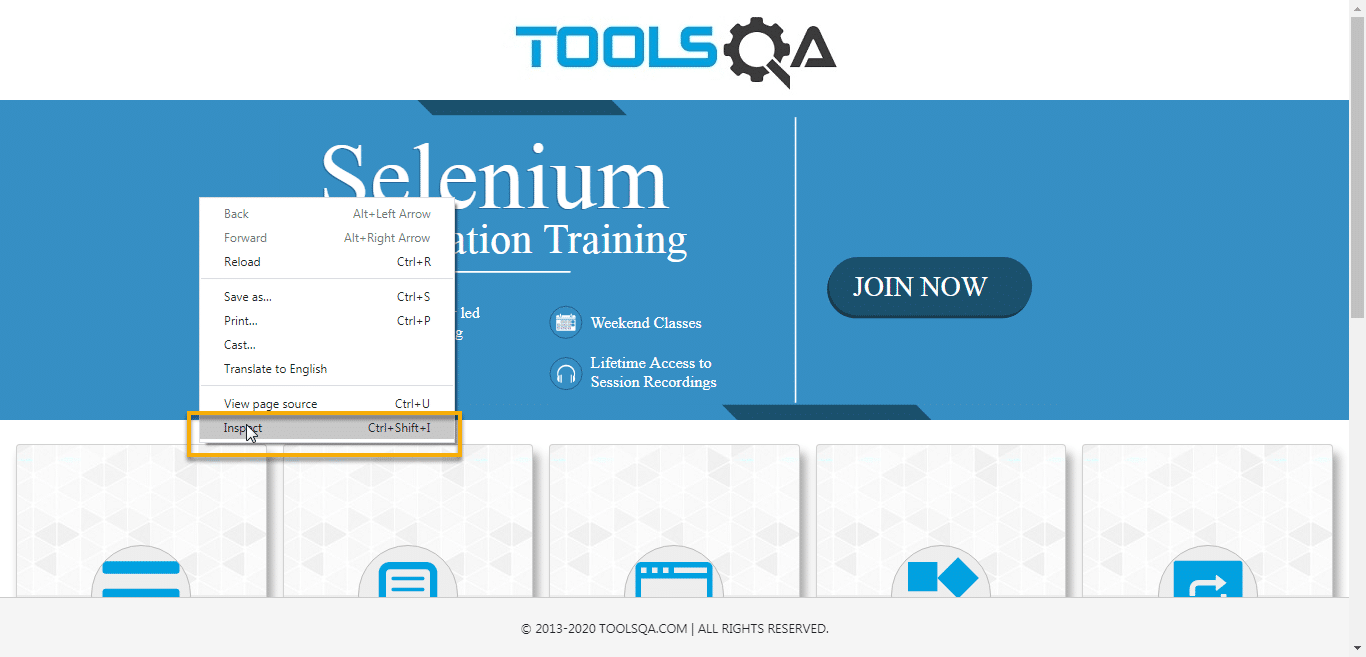
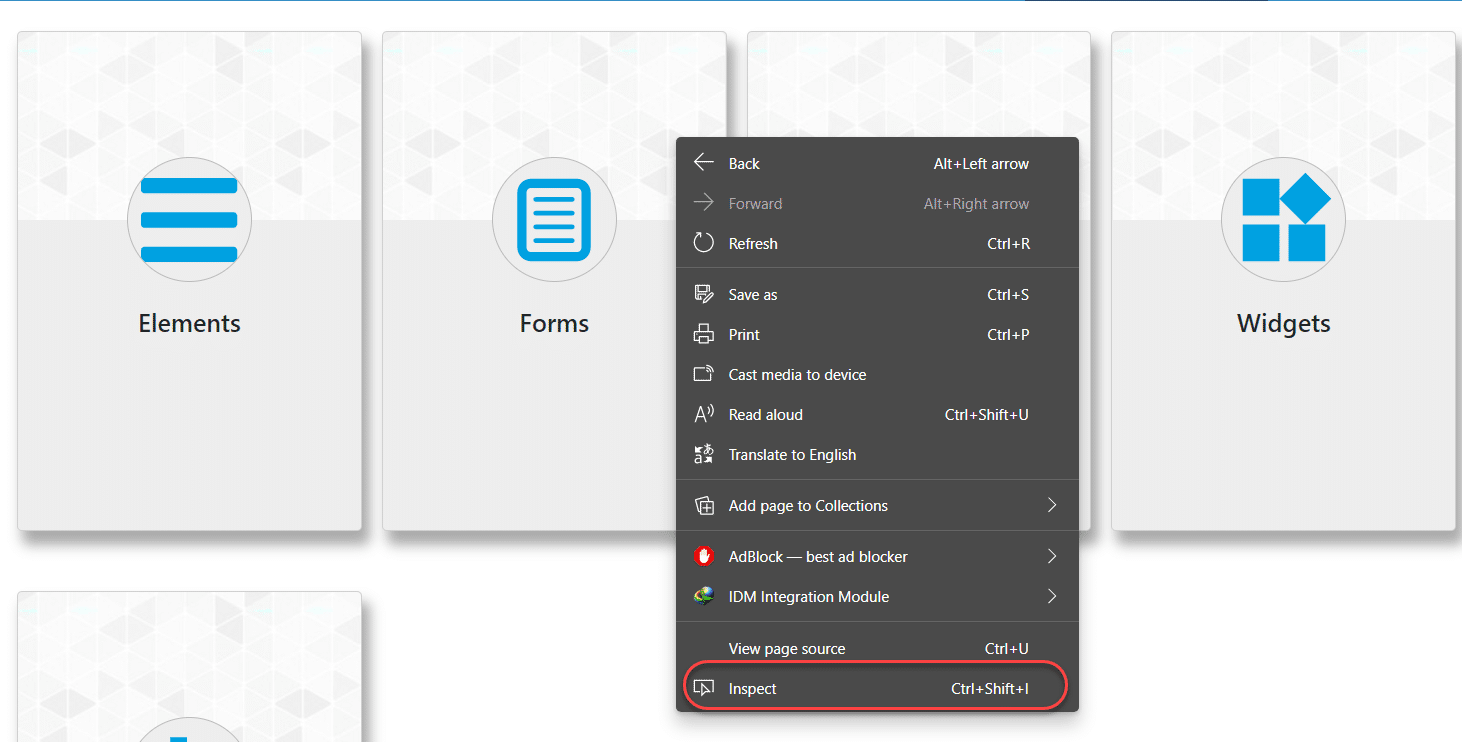
Although there are multiple ways to open up the web inspector and inspect elements on a web page, the easiest way is to right-click on the web page and select Inspect. We can also use the following shortcuts to open the web inspector.
- Windows: CTRL+SHIFT+C
- Mac: Command + Shift + C
Note: We are using the Google Chrome browser here for the demonstration.
A demonstration can be seen below on the Google Chrome browser as below:
A detailed guide on the inspect panel in Google chrome is worth reading to explore the inspect panel with full potential.
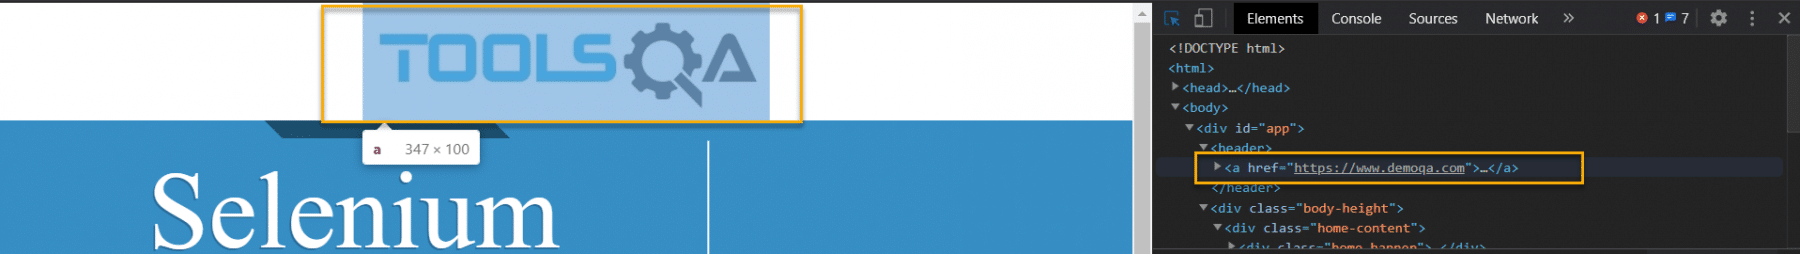
For the current tutorial, it is okay to know the elements we would like to inspect. Click on the below-shown icon after opening the inspect element panel.
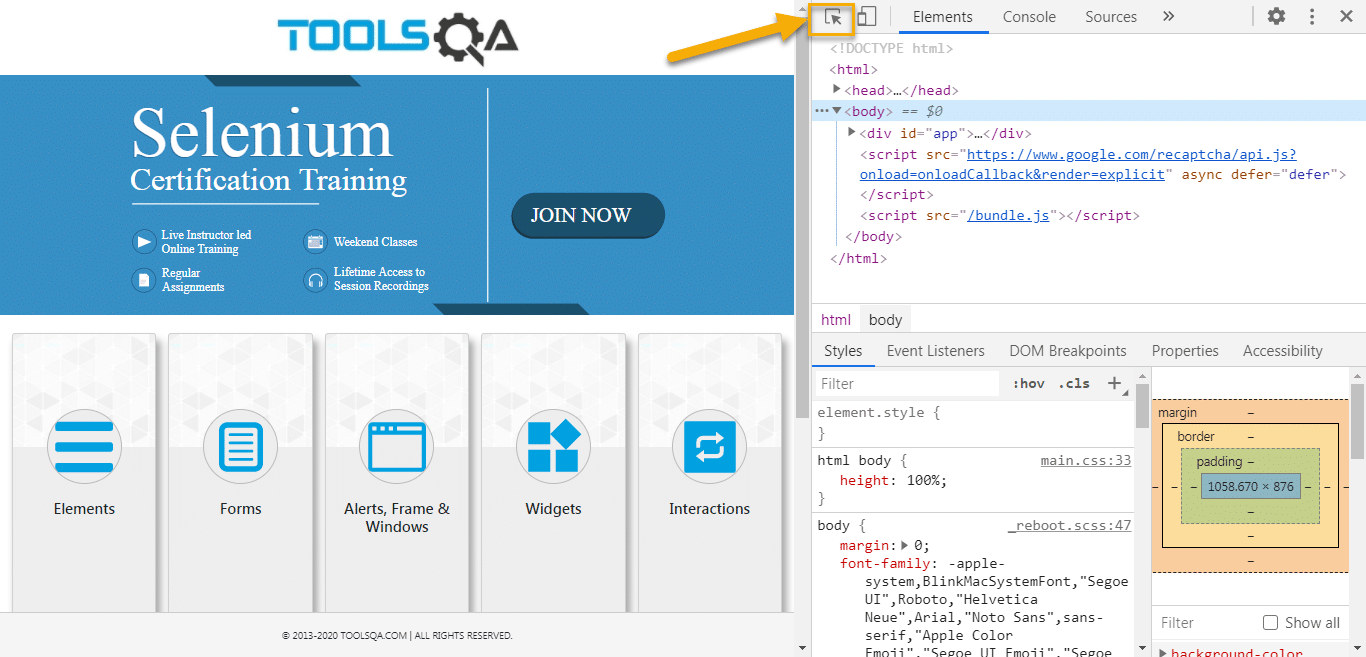
This icon will enable to hover inspection of the web element. Once you have clicked on it, if you hover on any element on the web page, it will be highlighted in the code Elements panel. This happens vice-versa too. Hovering over the elements in the code will highlight that particular element in the web page:
Although all the browsers contain web inspector and are more or less similar, slight changes still exist. Let's see how to open the inspect panel in various popular web browsers.
How to inspect elements in Google Chrome?
Follow these easy steps to inspect elements of a web page in Google Chrome.
-
Launch the Google Chrome web browser and open up the inspect panel by pressing F12 or the methods described above (right-click -> inspect).
-
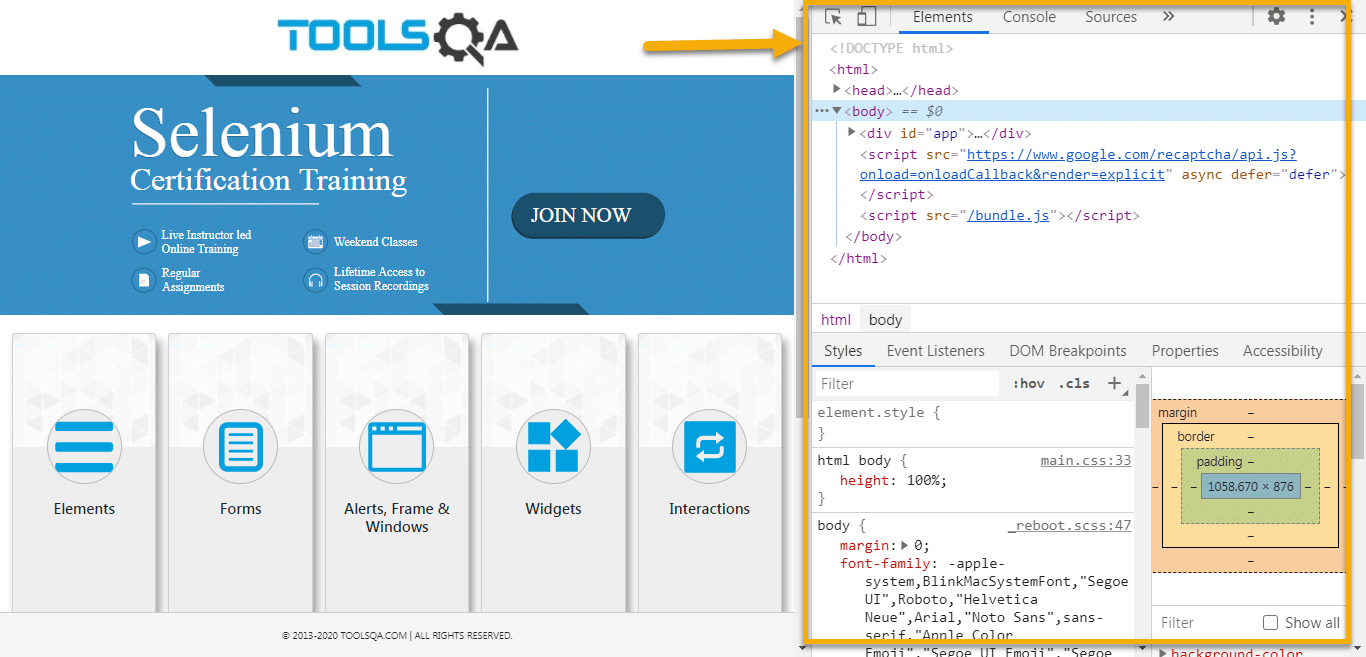
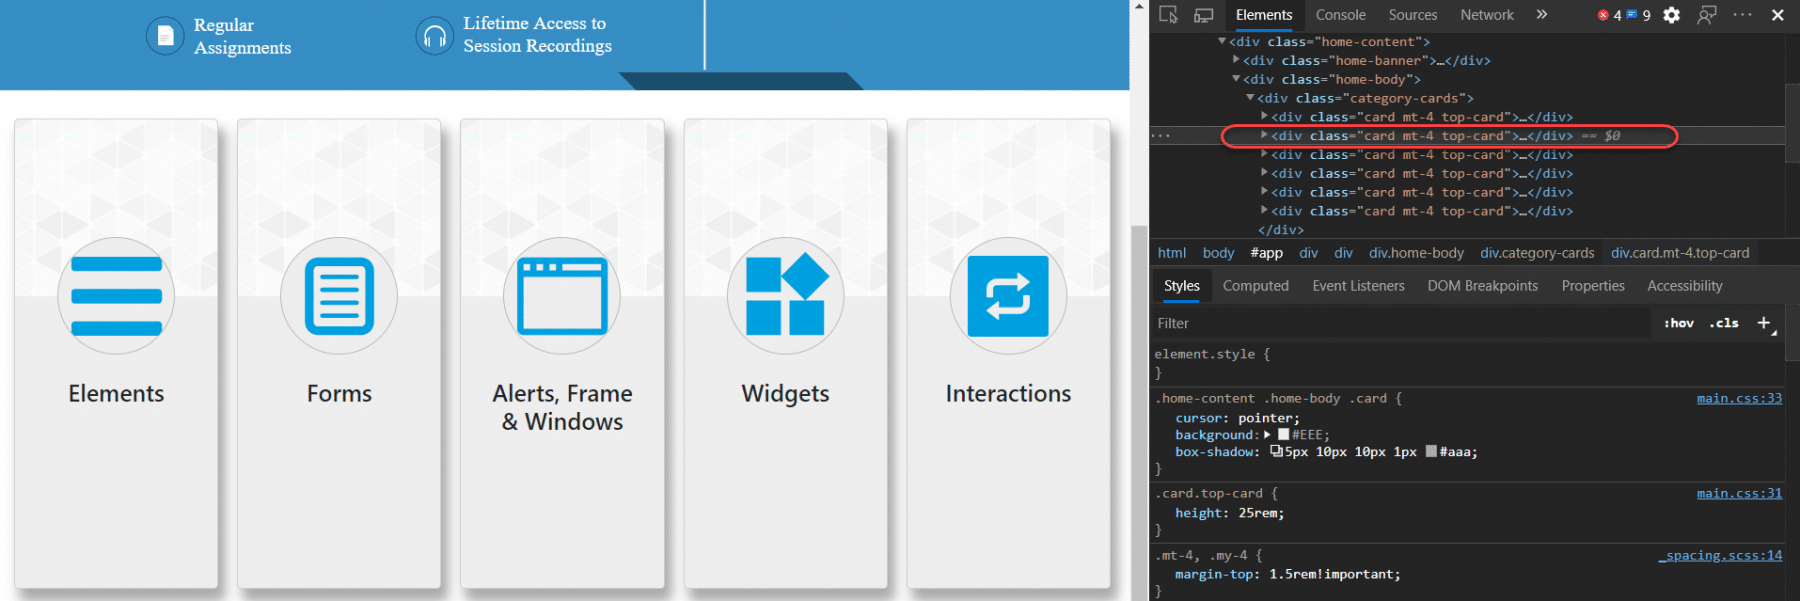
Once you open up the inspect panel, you would notice that there are multiple tabs available on the top, such as Elements, Console, Sources, Network, and Performance. However, the Elements tab is the one which consists of all the HTML properties belonging to the current web page (here I am using the website demoqa.com to demonstrate):
- In the below screenshot, after opening up the browser inspector, click on the Current Address text box. On the right-hand side (under the Inspect Panel ), associated element locators are highlighted automatically.
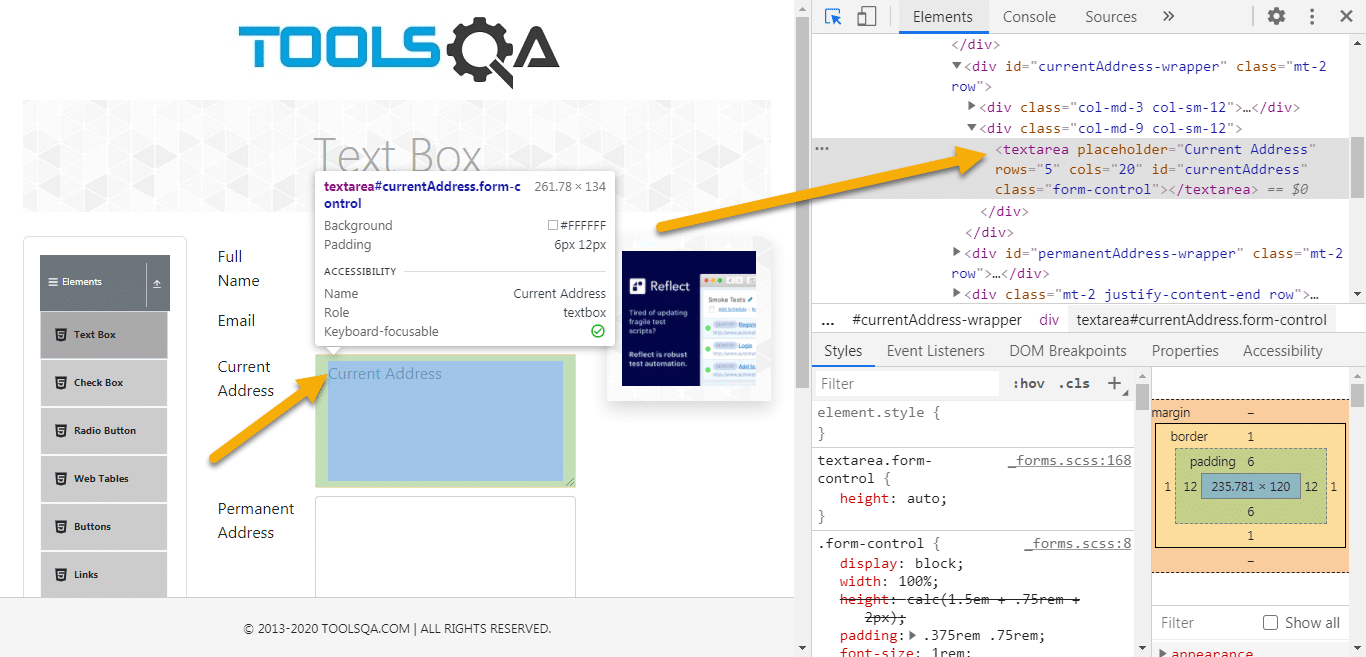
Note: Please observe that we are inside the Elements tab. If any other tab opened by default, please navigate to "Elements" first.
- Another way to inspect a web element is to right-click on the web element and click on the inspect option :
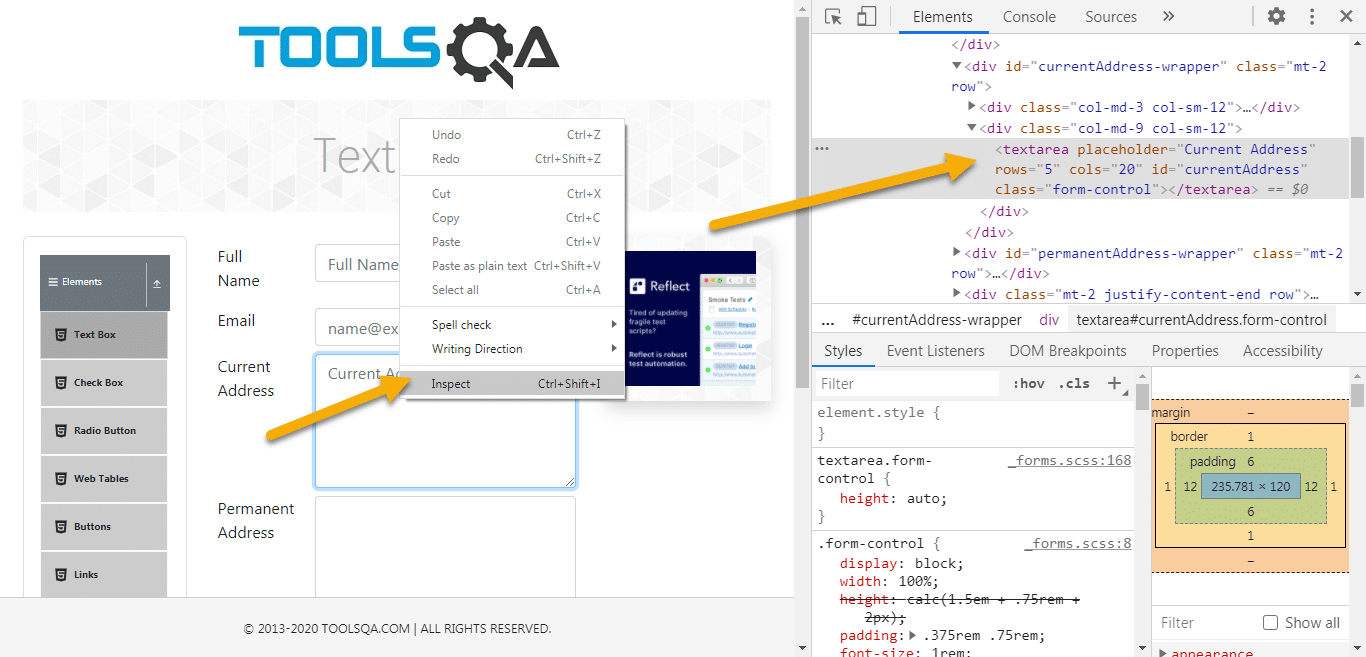
- Once you click on the Inspect context menu, it will highlight the row which is associated with the element, and you would see all the locator attributes in the Inspect panel, as shown below:
<input autocomplete="off" placeholder="Full Name" type="text" id="userName"
 class=" mr-sm-2 form-control">
You would see placeholder, type, id, and class as the Full Name text box's attributes in the above code. If you are keen to read an in-depth guide on inspecting Google Chrome elements, please visit Inspecting Elements in Google Chrome. The text boxes and web pages are also just for demonstrations; you can play around with any of the attributes or web elements.
How to inspect elements in Firefox?
Inspecting the elements in the Firefox browser is similar to inspecting the elements in the Chrome browser. Please do follow the steps as mentioned below to inspect the web elements in the Firefox browser:
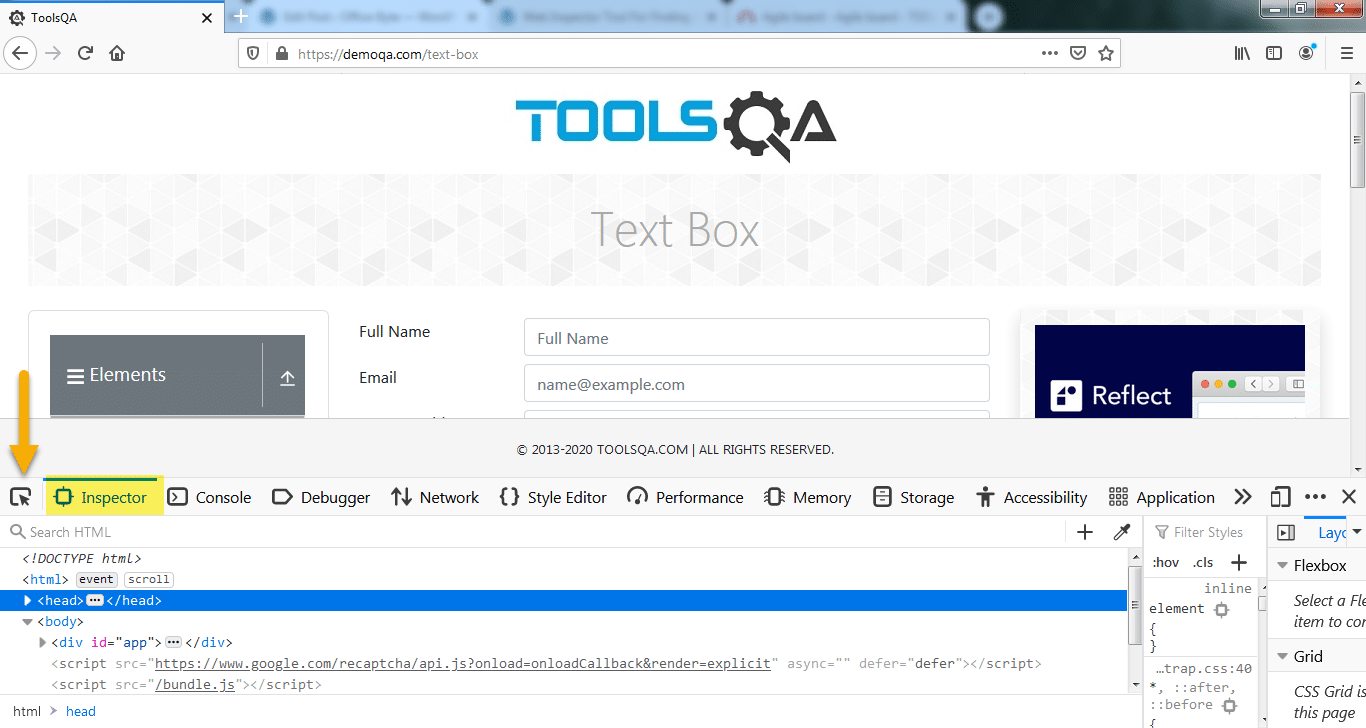
1.Launch Firefox browser and navigate to the page which you would like to inspect (here I am using the demoqa.com site, for example).
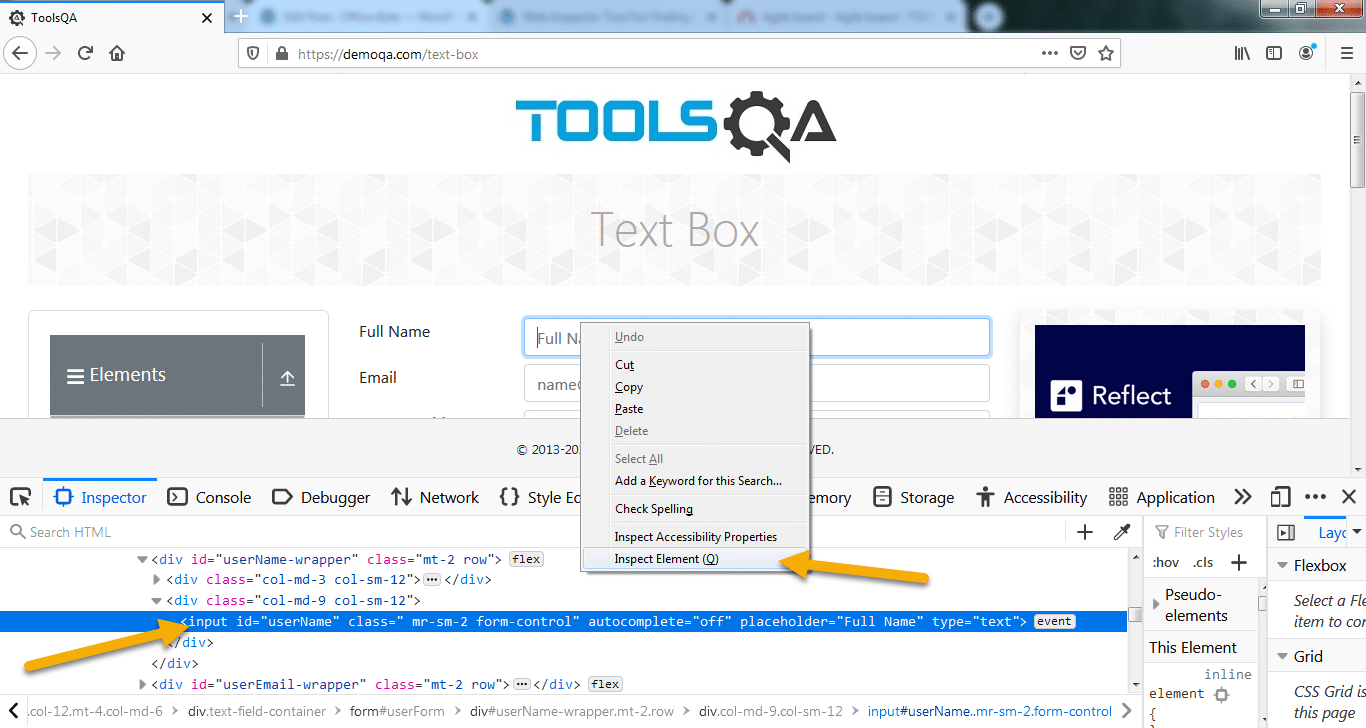
2.Another way to inspect an element is to right-click on the web element. After that, click on the Inspect Element (Q) option (Same as Chrome browser) :
Note: In the Firefox browser, "Inspector" is the tab where you would find all the HTML elements, unlike the Chrome Browser, where the tab was "Elements." Hence, please navigate to the Inspector tab. If it's navigated to any other tab while opening the Web Developer tools on the Firefox browser.
- Once the "Inspector" tab is opened, we can use the same steps to inspect the web elements, as we did in the Chrome browser.
How to inspect elements in Microsoft Edge?
Inspecting the elements on Microsoft Edge is the same as Google Chrome. The reason being that Microsoft Edge has moved to the chromium rendering engine on which Google Chrome is built. Therefore, they both show a similar underlying structure in their UI. We can follow the steps as mentioned below to inspect the elements in Microsoft Edge:
- Suppose we want to inspect elements on the ToolsQA Demo website to open the website in the Microsoft Edge browser.
- Clicking the Inspect option will open up the element which you wanted to inspect.
-
The application code and tags will be available under the "Elements" tab, as highlighted above.
-
We can follow the same steps to find, it will be highlighted in the code Elements panel and inspect elements. Moreover, we briefed the Chrome browser.
How to inspect elements in Internet Explorer?
Similar to above as Chrome and Firefox browser, press F12 and manually inspect the element by activating the web inspector or right click on the element and select Inspect Element(as highlighted below) to open the developer tools. This process is similar to Chrome and Firefox showed in the image:
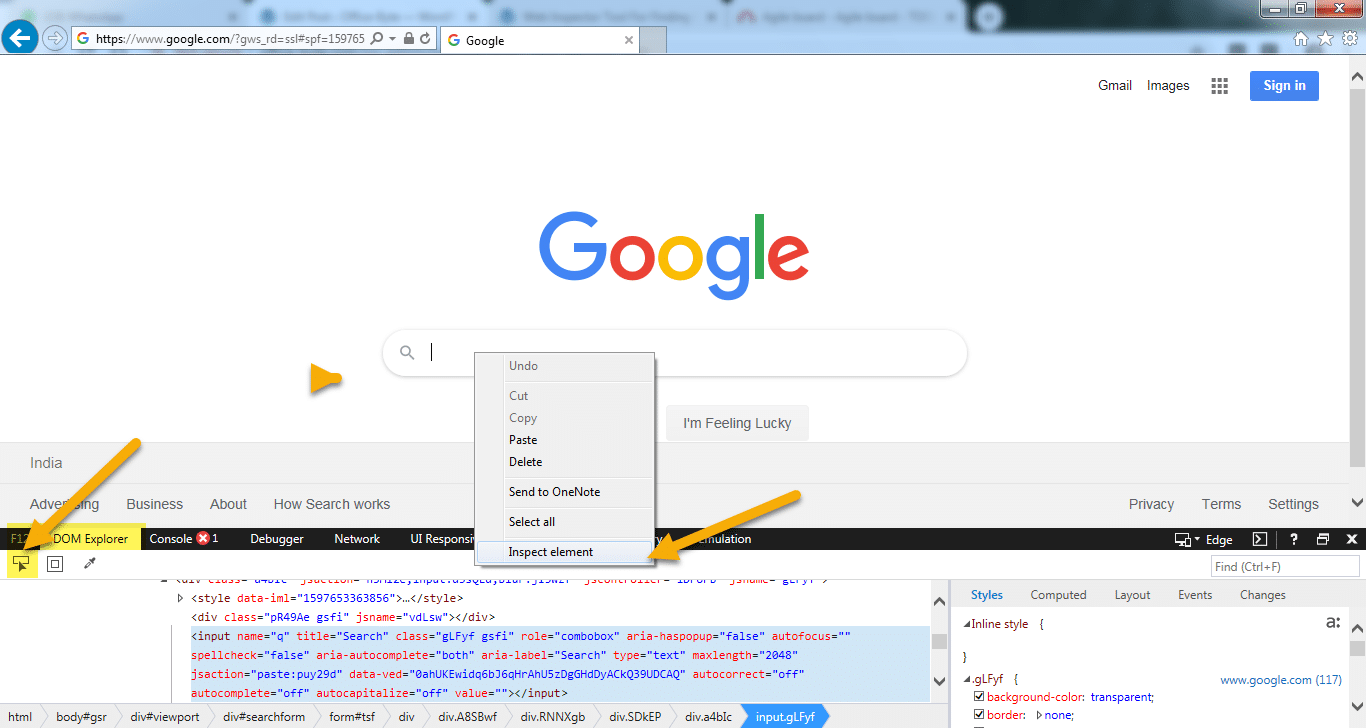
Note: "DOM Explorer" is the tab where you would find all the HTML elements, unlike Chrome Browser, hence please navigate to the DOM Explorer tab if it's navigated to any other tab while opening the web developer tool on the Internet Explorer browser.
Until now, we have learned about how we can inspect the web elements in various modern browsers. We can refer to the detailed articles corresponding to each of the browsers to understand in more detail about locating elements in a specific browser. Now, as we discussed, we can use the browser developer tools for debugging purposes also. Therefore, let's see how we manipulate various properties of the elements and validate the same in the browser itself:
How to manipulate Web Elements using Web Inspector?
Using the web inspector, it's possible to change or manipulate web elements for testing/debugging purposes. You can update various CSS attributes such as height, width, sizes, text, or any other style element by just double-clicking on the element. Using the web inspector, one can edit certain parts of JavaScript and HTML as well. Let's learn how we can achieve all these manipulations, with the help of examples in the following sections:
How to manipulate HTML attributes using Web Inspector?
Let's take an example where I am trying to change the text of a web element using the inspect panel in Google Chrome browser:
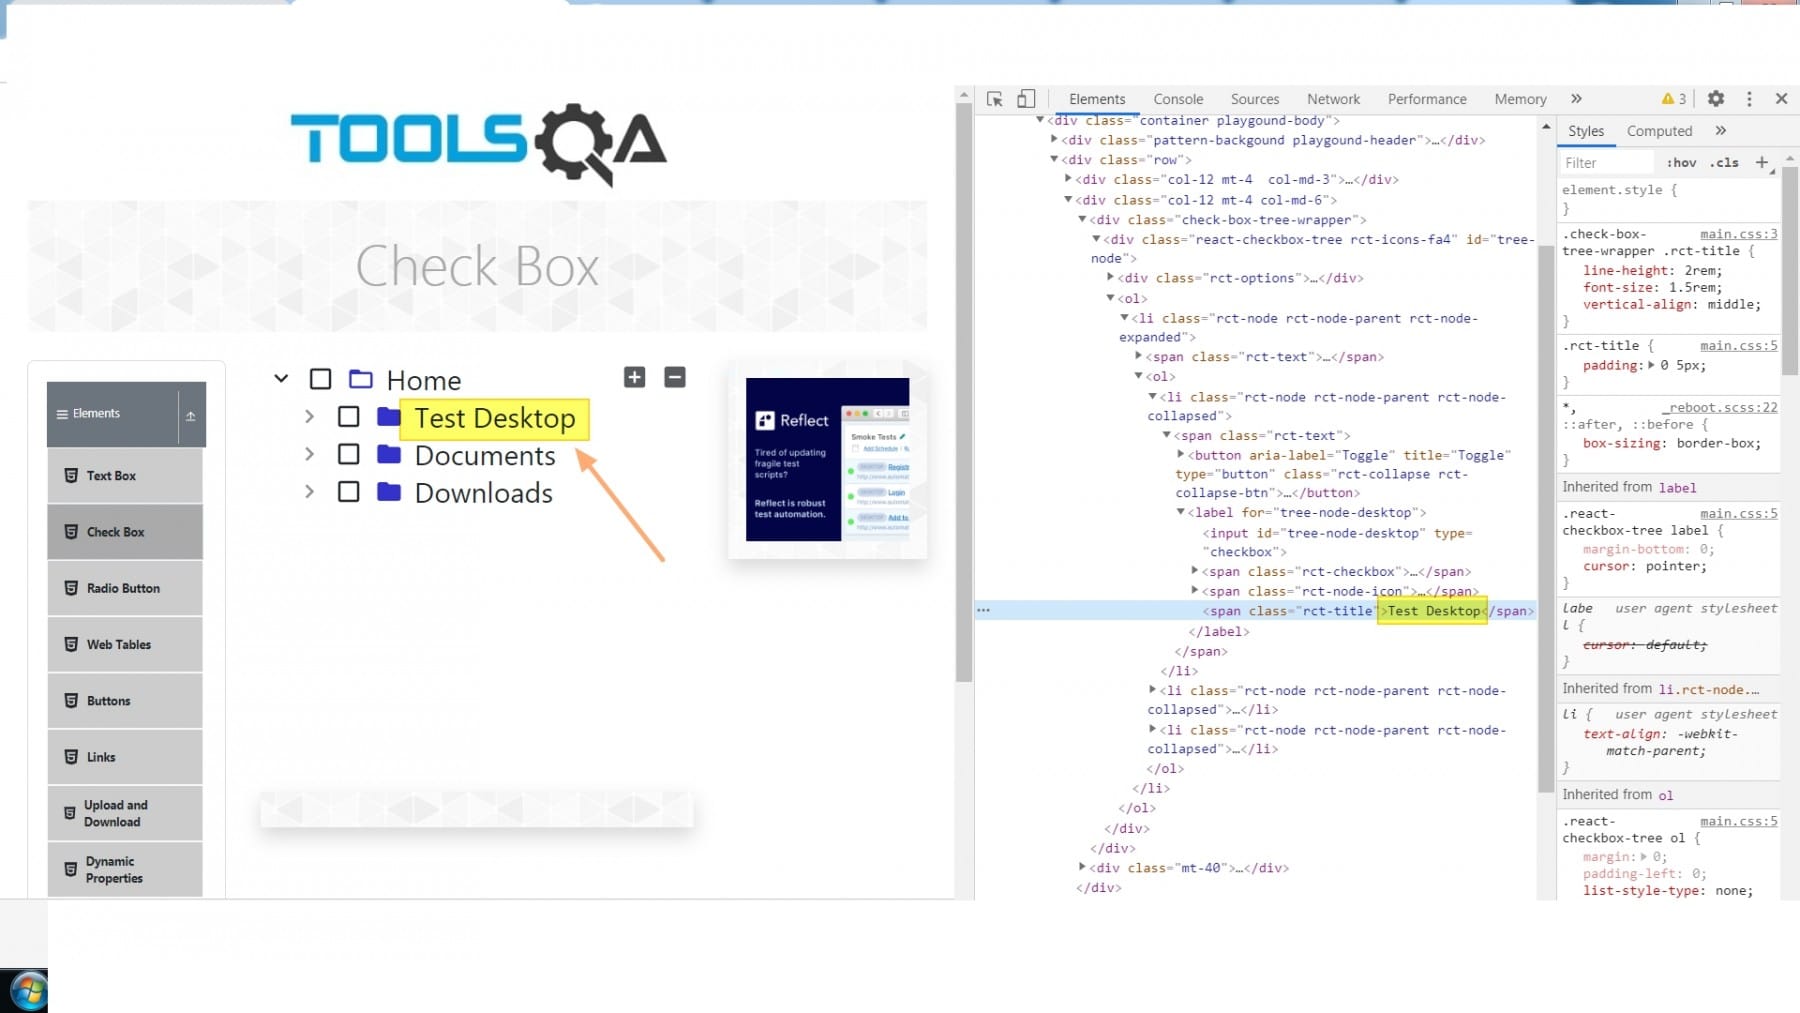
- Navigate to the URL "https://demoqa.com/checkbox" and right-click -> inspect on the word "Desktop" as shown below:
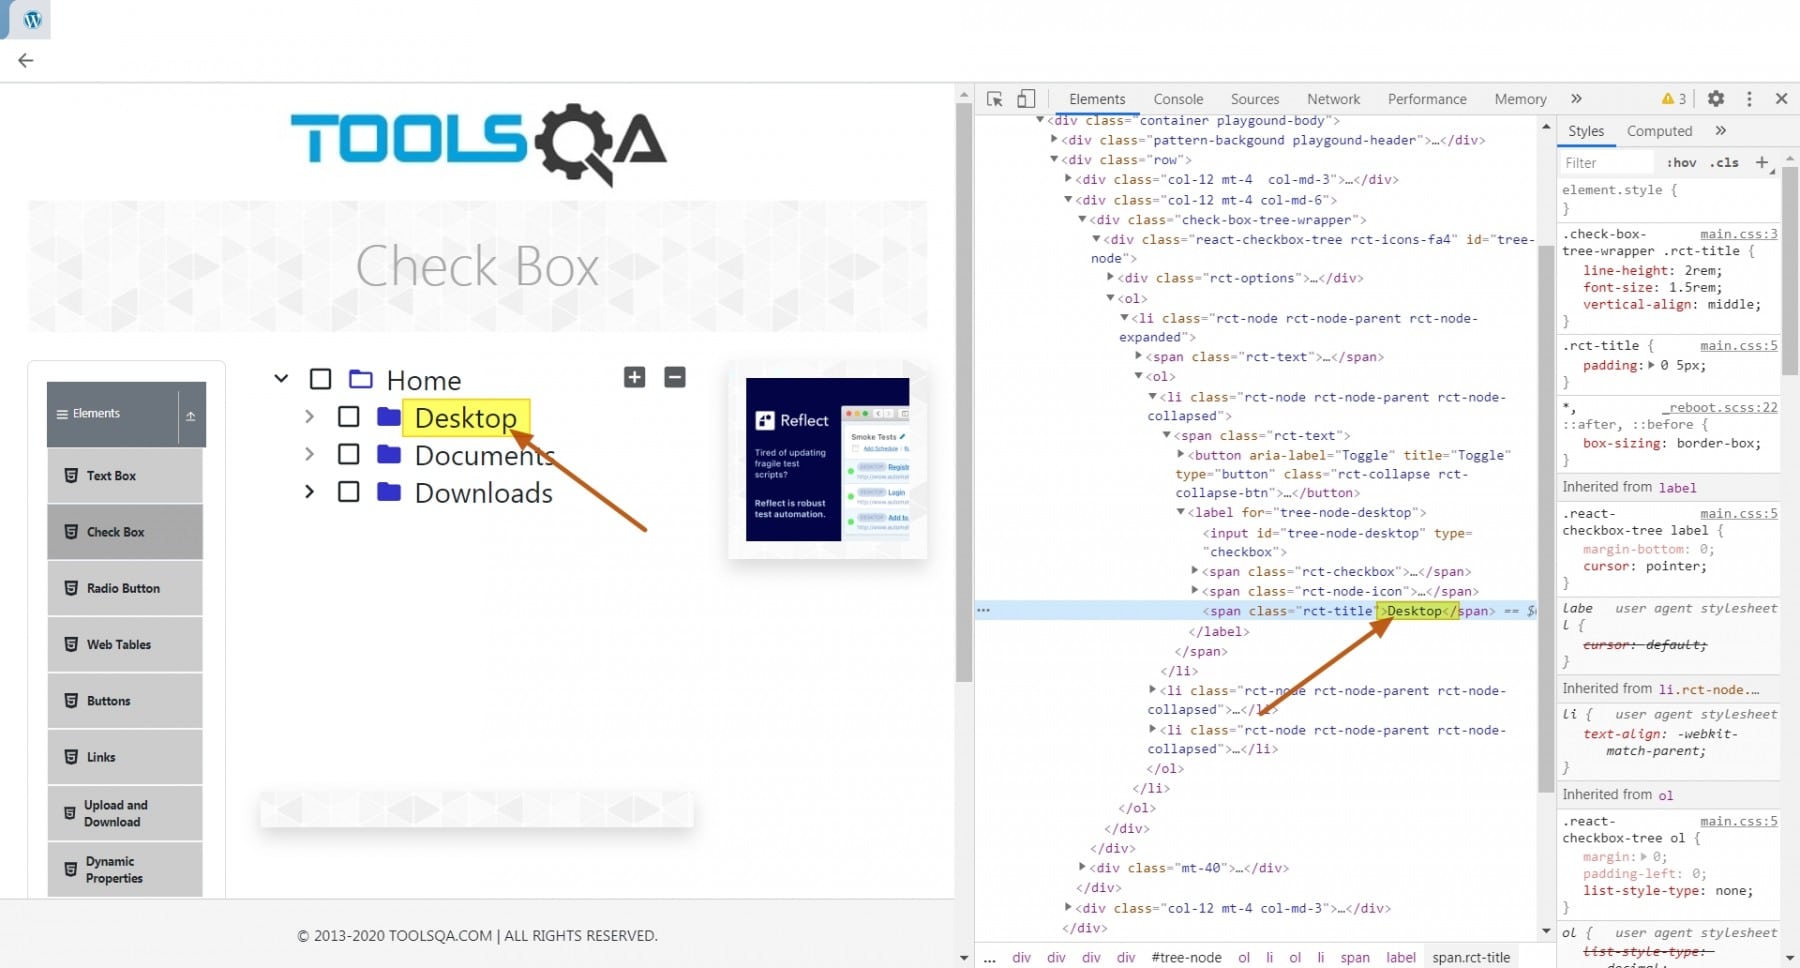
- Update the text from "Desktop" to "Test Desktop" by just double-clicking on "Desktop" in the Elements panel. As shown below, as we update the text in the Elements panel, the text also updates on the web page:
So, update any attribute of the HTML tags under the Elements panel. Consequently, preview its results live in the browser.
How to manipulate CSS attributes using Web Inspector?
Consider a scenario that on the same page, "https://demoqa.com/checkbox", we want to update the background color of a web element; let's see how we can achieve the same:
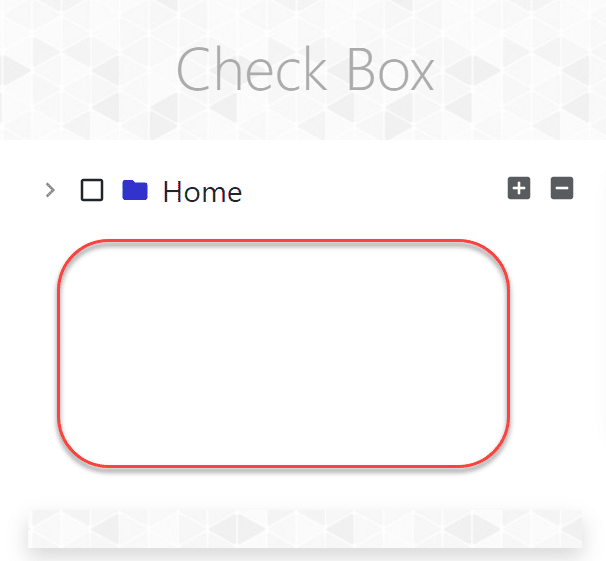
- Navigate to the URL "https://demoqa.com/checkbox", and right-click and inspect the white box just below the folder names, as highlighted below:
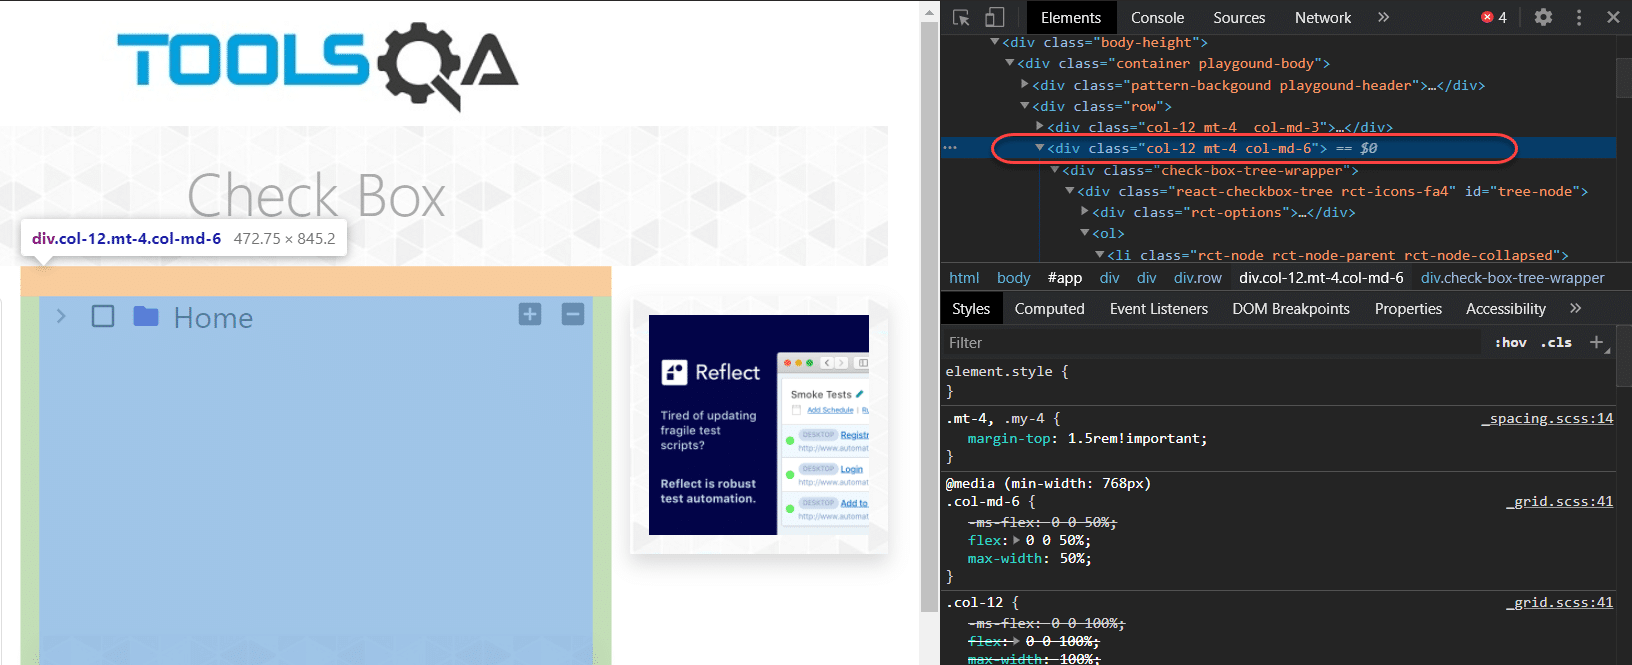
- This will lead us to the code representing this white div box as highlighted below:
- Double-click this line of code and add the style attribute as shown in the following line:
<div class = **"col-12....."** style = **"background-color: cyan"**>
- Press enter and see the white div box's color changed to cyan.
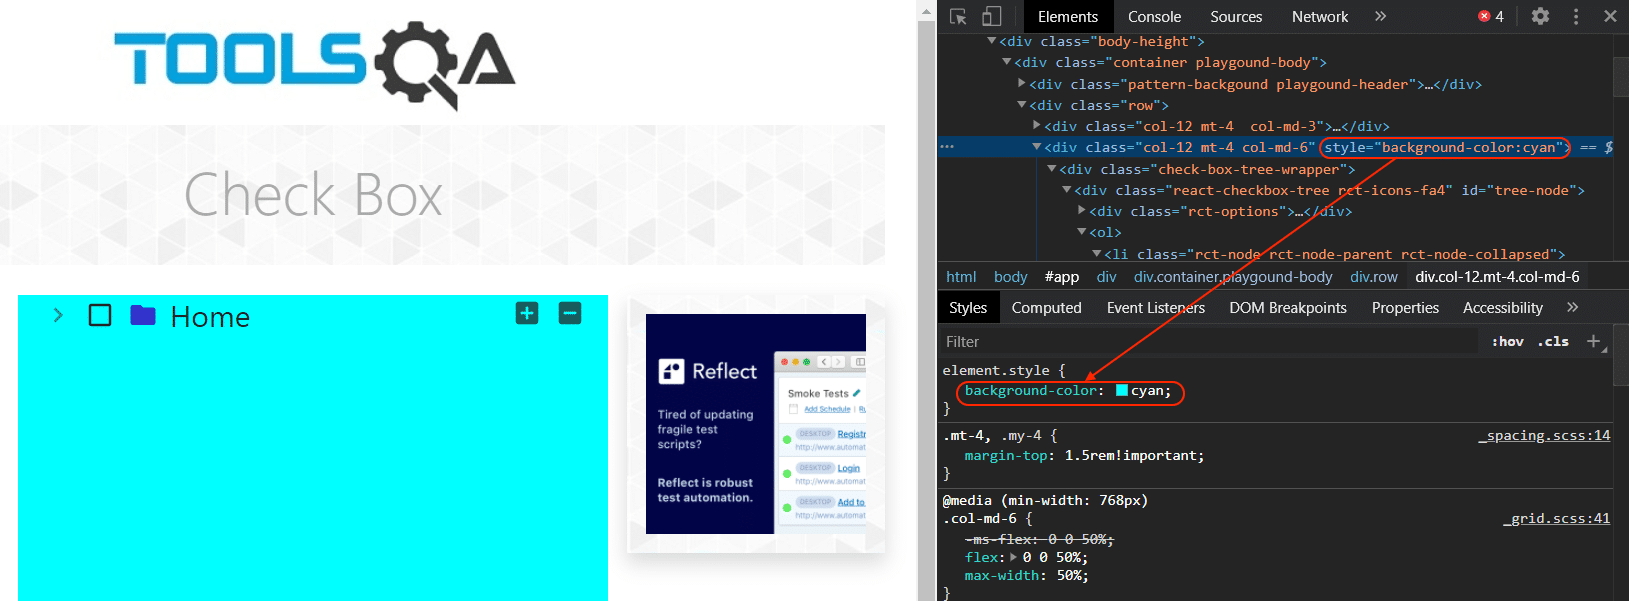
As highlighted above, all the CSS attributes will be shown in the "Styles" tab. They will appear either below or to the right of the Elements tab section. We can either embed the CSS attributes in the HTML tag itself or add/update the Styles section's values directly.
- If I update the value of the attribute "background-color" to "caderblue" directly under the Styles tab, it will reflect the corresponding changes in the browser, as shown below:
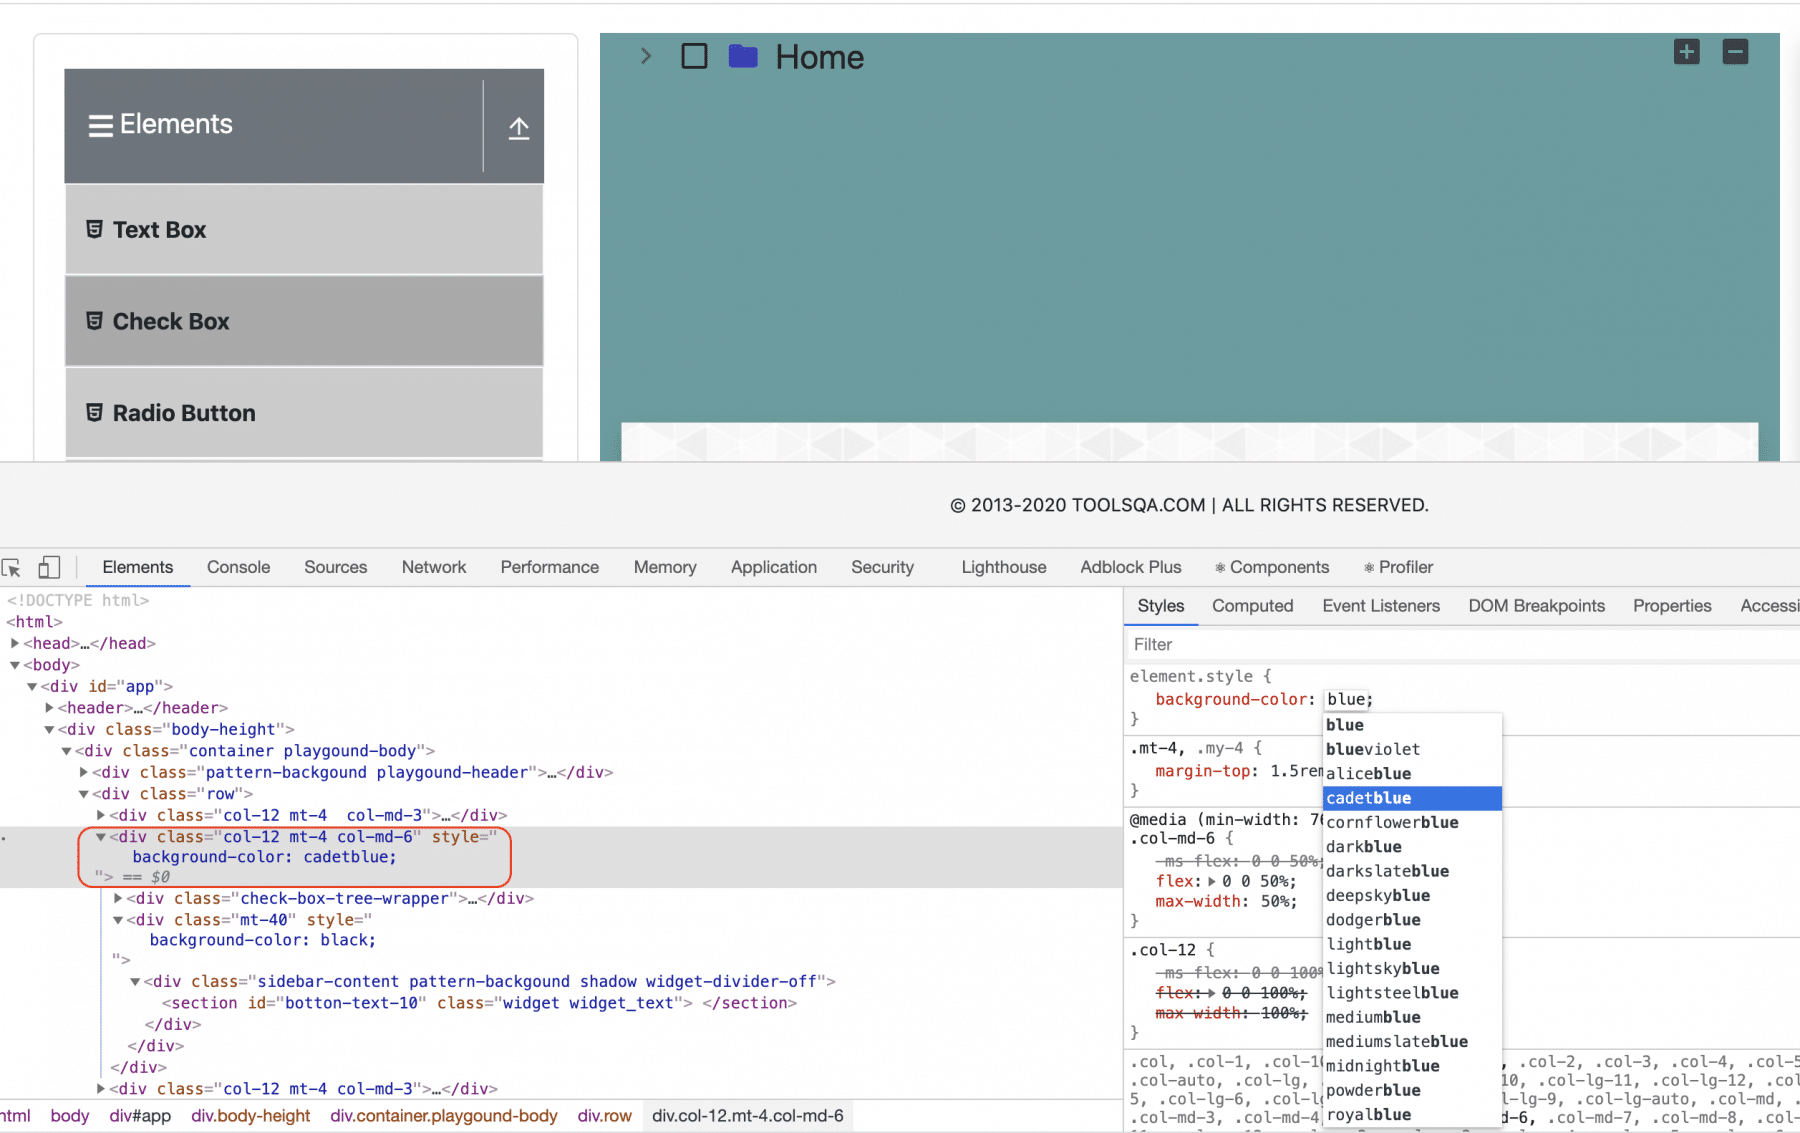
As we can see, as soon as we start writing the CSS property or its corresponding values, the browser itself shows all the possible values. Additionally, it also helps in debugging/changing the corresponding value. As in the above case, when we hovered over the value "caderblue", it reflected the same color in the browser. So this way, we can manipulate any of the CSS properties directly inside the browser.
How to manipulate JavaScript attributes using Web Inspector?
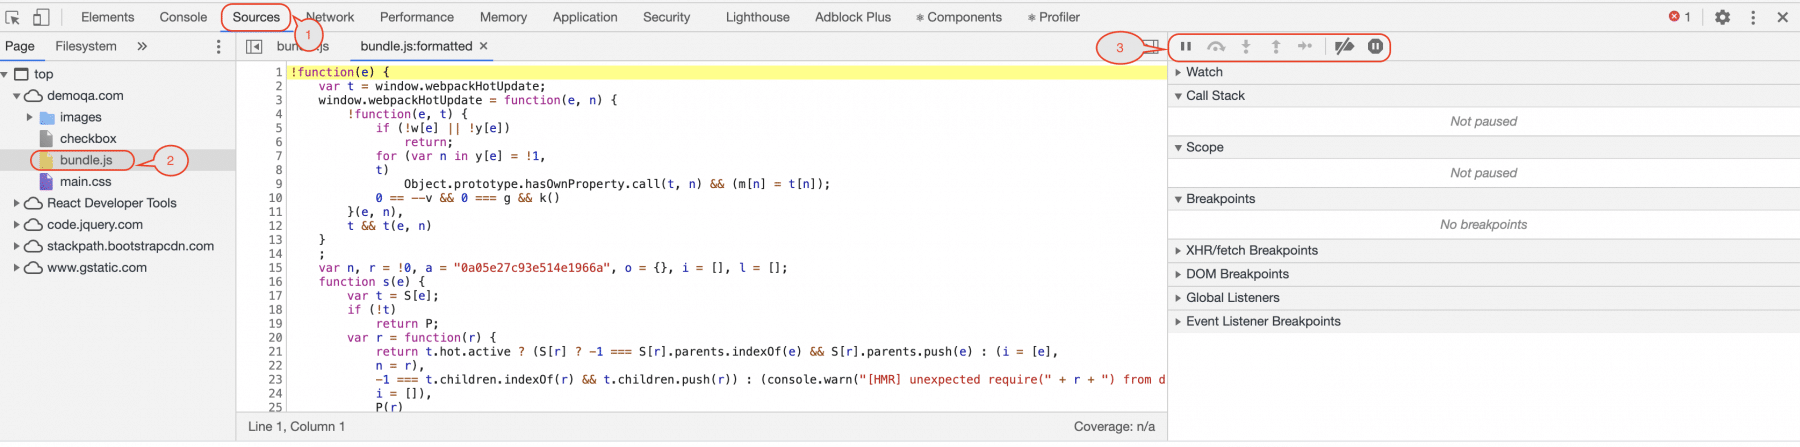
The JavaScript files of your application will reside under the "Sources" tab of the Inspect panel, as shown below:
-
When you click on the "Sources" tab, you will see all your source code files listed in the left panel. It is highlighted by marker 1 in the above image.
-
In this left panel, you can select your corresponding JavaScript file, which you want to update/manipulate. As in our application, there was only one JavaScript file, named bundle.js(as highlighted by marker 2 in the above image).
-
As soon as you select the JavaScript file, the execution panel on the right side will be activated. It is highlighted by marker 3 in the above image.
-
After this, you can make the needed changes in the JavaScript and preview the corresponding changes directly inside the browser.
Note: All these changes of HTML, CSS, JavaScript will be temporary and will get lost asap you close the browser tab. So, it was just a temporary interface to debug and view any planned changes quickly.
Key Takeaways
- The web inspector is a panel available in every browser that allows you to navigate the components that render the web page you see.
- Also, a user can inspect an element using CTRL+SHIFT+C.
- Additionally, by inspecting the browser elements, you can modify the web element to see the UI's instant changes. But remember that does not make any permanent change in UI.