
Google Chrome is the leader in the market of all the modern browsers available these days. No doubt, it's one of the favorite browsers for the web developers and also is one the leading choice for all the QA engineers working on UI automation. Additionally, Chrome has grown and matured with time and provides various features that help the developers and testers to validate the application inside the browser itself. All these useful tools and options combine under the "Developer Tools " option of the Chrome browser, which provides various options for editing/debugging the HTML/CSS and JavaScript. Additionally, it also provides the capabilities to "inspect element", which is a beneficial tool for the testers.
WebElements inspection is at the center of Selenium Automation. Earlier, we had Firebug&Fire-path tools for this purpose. Today we have several add-ons and plug-ins that can be used with the browsers to inspect an element in the DOM (Document Object Model ). But using Developer Tools to inspect the element and modify the DOM is much more efficient and comfortable than using plug-ins or add-ons. After all, they embed due to a reason.
So let us begin with this chapter of Inspect elements in Chrome using Developer Tools. Subsequently, we will be covering the following topics in this article.
- What is the Chrome DevTools Panel?
- How to access the Chrome DevTools Panel?
- How to dock/undock the DevTools panel?
- Inspecting an element using Chrome DevTools
- Why inspect an element?
- How to inspect element in Chrome Dev Tools?
- How to locate elements using Chrome DevTools?
- Locate an element by a String
- Locate an element by CSS Selector
- And, locate an element by XPath.
What is the Chrome DevTools Panel?
Chrome developer tools provide a feature called "DevTools Panel "or "Element Panel", using which we can inspect elements and modify them from the front-end for the debugging purpose. We can also alter the appearance and even contents of the web page as we can edit "CSS " and "HTML" files at run time and perform quick debugging of the application.
So how do we access the elements panel in Google Chrome developer tools? Let's see various ways to achieve the same:
***How to access the Chrome DevTools Panel? ***
Follow the steps as mentioned below to access the DevTools Panel in Chrome Browser:
-
Firstly, click the "Customise and control Google Chrome" button (3 dots in a vertical line) on the upper right side of the browser screen.
-
Secondly, after that, click on More tools->Developer Tools.

- Thirdly, as shown in the above image, we click on Developer Tools, which opens up the element box in the chrome developer tools section. Subsequently, the image below shows how the element box looks like:
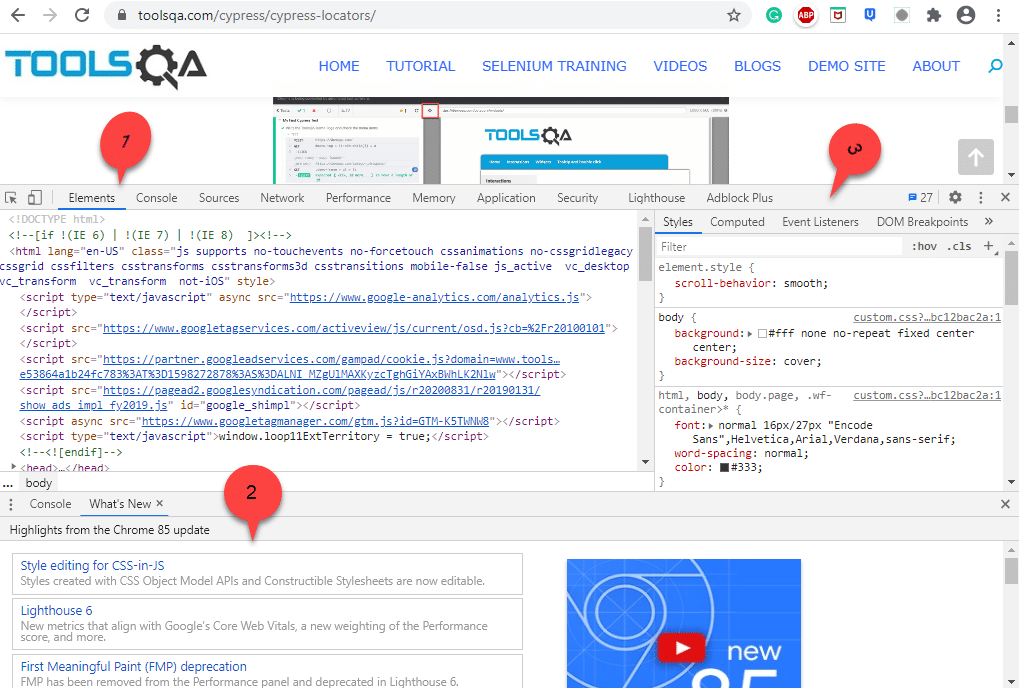
This section majorly consist of three parts, where,
- DOM panel: DOM panel (marked 1) is the upper part of the box under the Elements. It is a tool using which we can change the HTML page layout. Here we have full control of the HTML and can modify files freely.
- Console panel: Console panel (marked 2) is in the bottom part of the element box and shows the log messages that are logged by developers in the script. It also shows what's new in the Chrome developer tools.
- CSS panel: The CSS panel (marked 3) changes the CSS properties — fonts, sizes, and colors of the webpage.
Apart from clicking on "More tools-> Developer Tools", we can also open the element box using the following options:
- Clicking the F12 key.
- Using keyboard shortcut, "Ctrl + Shift + i" or "Ctrl + Shift + c" on Windows Operating System. The same command works on Chrome OS and Linux.
On Mac OS, we can use the command "Cmd + Opt + C " to open chrome developer tools.
- Right Click on the webpage in Chrome Browser and click "Inspect" .
We can use any of the above options to open the element box in the Chrome developer tools.
How to dock/undock the DevTools panel?
We can also dock the Chrome Developer Tools window to the left/ right or bottom of the window or even undock it to a separate window.
The docking options are provided in the Elements panel, as highlighted below:
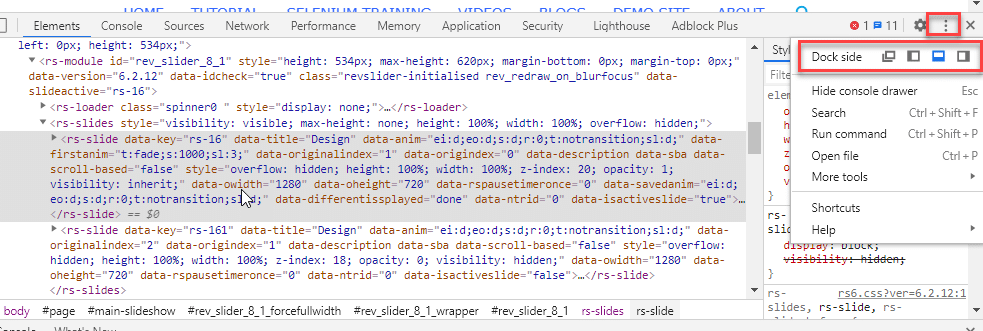
When we click on the three verticle dots in the top right corner of the window, we get the "Dock side" option along with other options. This option has the following suboptions (indicated by small images next to option) using which we can dock the window as per our requirement.
- Undock into a separate window
- Dock to left
- Dock to bottom
- And, Dock to right
So, clicking on any of these options, we can dock/undock the DevTools panel to any of the positions on the screen, as per our comfort and need.
As we discussed, one of the major features provided by the Chrome DevTools panel is to provide the capabilities to inspect a web element and find various types of locators using which we can locate the elements in the Selenium test cases. Subsequently, let's see how we can inspect different web elements using the DevTools panel and identify various locators of the web elements.
Inspecting an element using Chrome DevTools
Before we proceed with how to inspect the element using Chrome DevTools, we will first try to answer the question,"What is the need to inspect an element? "
Why inspect an element?
The inspect element provides the following benefits/use-cases depending on who is the consumer/user of the same:
| Role | Use case |
|---|---|
| Developers | If developers need some temporary changes to the web page, then the inspect element is the best solution. |
| Digital Content Writers | When digital content writers need a screenshot of a webpage containing sensitive information, he/she may use the inspect element to remove the sensitive content. |
| Web Designers | Web designers need this feature to check various design and layout changes they make to the webpage. |
| Digital Marketers | Digital marketers can use inspect elements to their advantage on their competitor's webpage by allowing users to see hidden keywords on the website. The inspect element can also show us if the page is loading too slow or too fast |
| Support agent | The support agent explaining the fixes on the website to the developers may want us to show some quick fixes which can happen using the inspect element |
The points discussed above are just a few examples of the inspect element uses. The inspect element tool has far more uses in web development.
How to inspect/highlight elements in DOM?
There are various ways to inspect/highlight elements using Chrome Developer Tools. A few of them are:
Inspect the elements directly from the Web Page:
- First, select the element on thewebpage, which we need to inspect and then right-click. Now select "Inspect " in the context menu that is displayed.
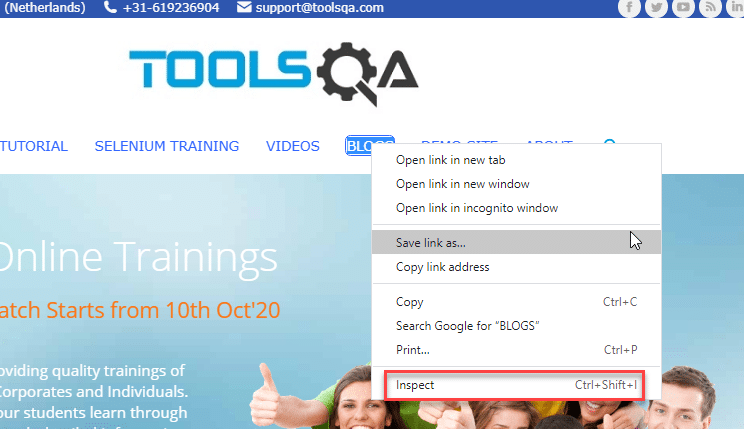
- Secondly, the DOM (element box) will highlight the selected element.
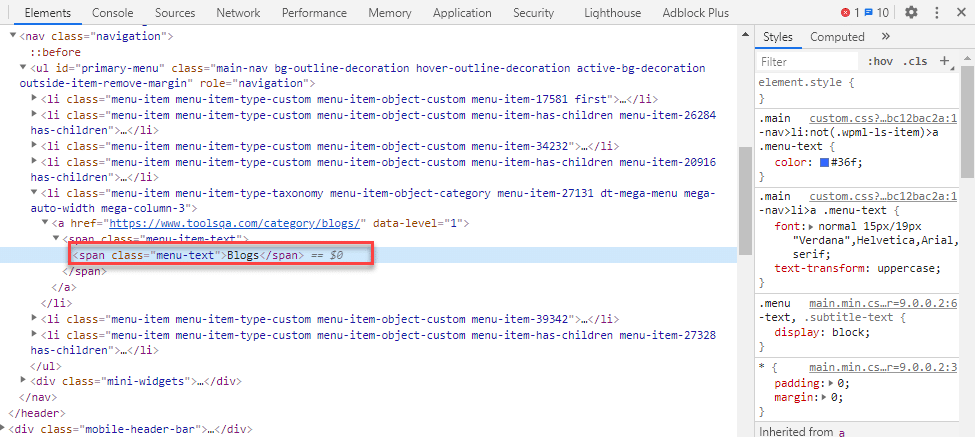
In the above image, we have selected the element "BLOGS " on the webpage and then right-clicked and selected the Inspect option. Consequently, in the DOM panel, we can see the corresponding element is highlighted (indicated by a red-colored rectangle).
Inspect the elements using the DOM panel of DevTools:
The next approach to inspecting the element is using the DOM panel. Open the DOM panel of the Chrome DevTools and follow the steps as mentioned below to check a web element:
- First, click on the "Select element" button in the top left corner of the DOM panel (as highlighted by marker 1 in the following screenshot). After that, you can click on the element you want to inspect; the element will highlight.
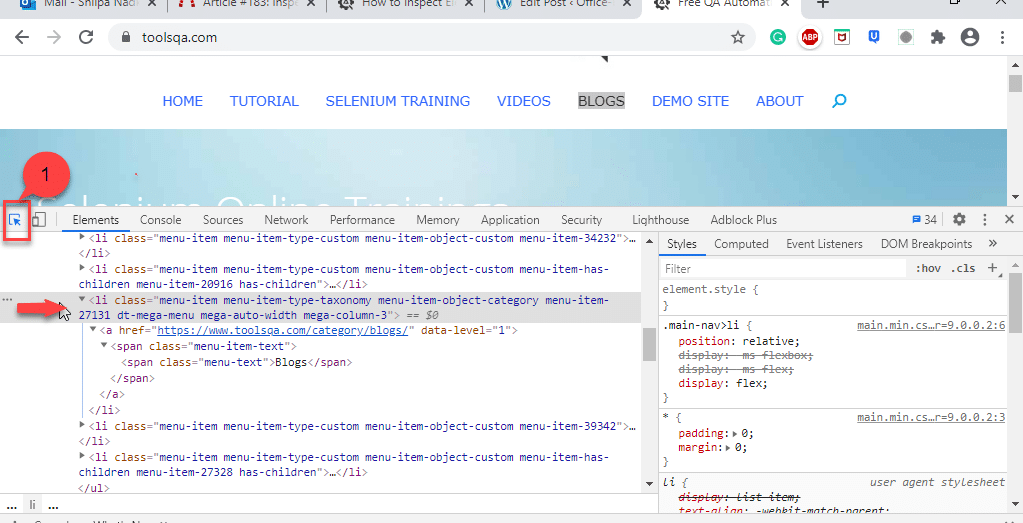
In the above picture, pointer 1 shows the "select an element " button. When we click this button and then select any element we want to inspect, that element gets highlighted on the webpage. For example, in the above image, we have selected the menu class, and that element gets highlighted (BLOGS in the navigation bar).
How to locate elements using Chrome DevTools?
The DOM panel of Chrome DevTools provides a special tool called "find " to locate the web elements depending on specified criteria. So when browsing the DOM panel, we can search for various nodes/elements using this 'find' tool.
So how do we search a node/element in the DOM Panel? After opening the Chrome Developer Tools, press "Ctrl + f " and open a find bar(as highlighted below) for you in the DOM panel wherein you can enter the search criteria.
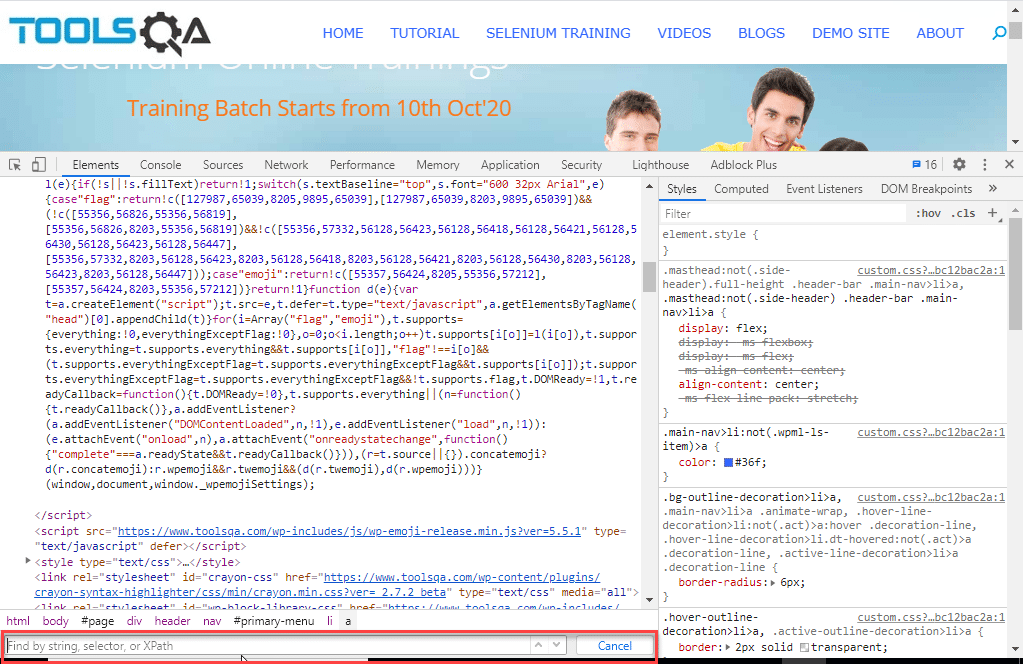
The find tool indicates the red square in the above image. We can see that the criteria that we can specify in the find tool are string, CSS selector, or XPath. Hence we can search for elements or nodes in the find tool:
- by specifying a String
- by specifying CSS selector like HTML tag
- And, by specifying XPath like an Id.
Locate an element by a String
In the DOM panel, we can provide any string to search for an element, as shown below.
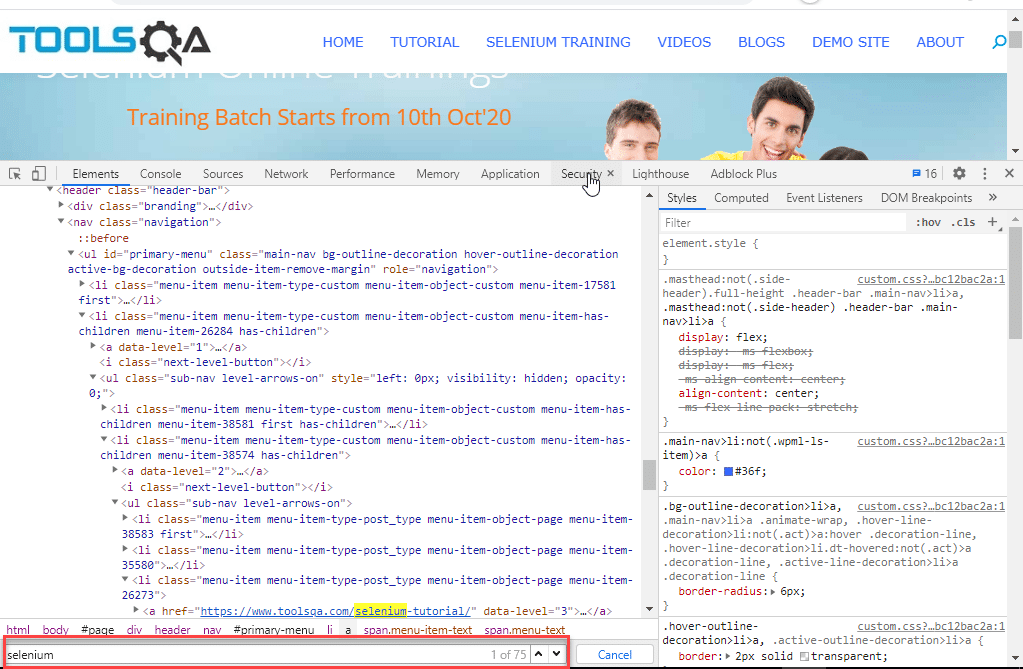
In the above image, we have specified "selenium" as a string. It highlights all the entries with the value "selenium". We can see at the right of the find tool that gives us the total number of entries and which entry (number) is currently highlighted (in the above image, the total findings being 75). It also gives us a button for scrolling the entries.
Locate an element by CSS selector
We can also specify the CSS selector in the find tool, and it will give us all the entries associated with the specified selector. So how do we find a CSS selector for a particular tag?
In the elements panel, we can right-click on any tag for which we want the CSS selector and select the Copy option. Then we can copy the tag as a CSS selector. It is as seen in the below screenshot.
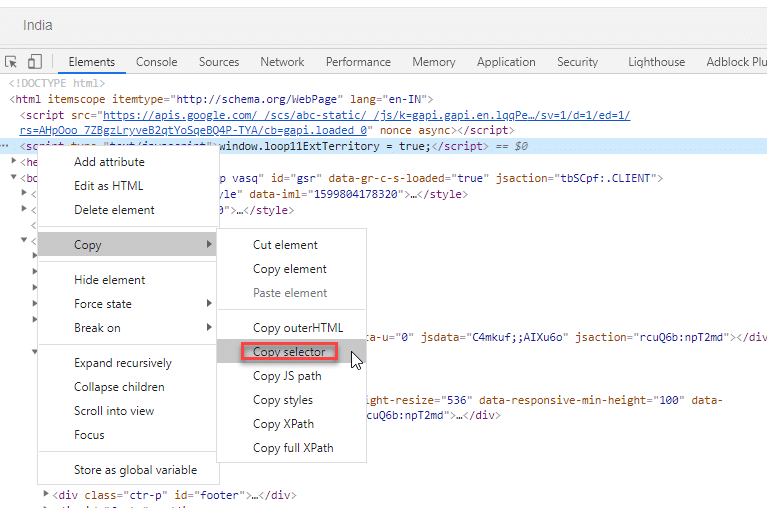
So in the above figure, as an example, we had selected the <script> tag and copied its selector as shown above. The selector is
html > script:nth-child(2)
Note that nth-child(2) implies the exact tag which we had selected. The general selector for <script> tag will be:
html > script
From the above screenshot, it is evident that we can also copy the XPath, full XPath, JS Path, etc. using the Copy option. The image below shows an example of providing a CSS selector in the find box.
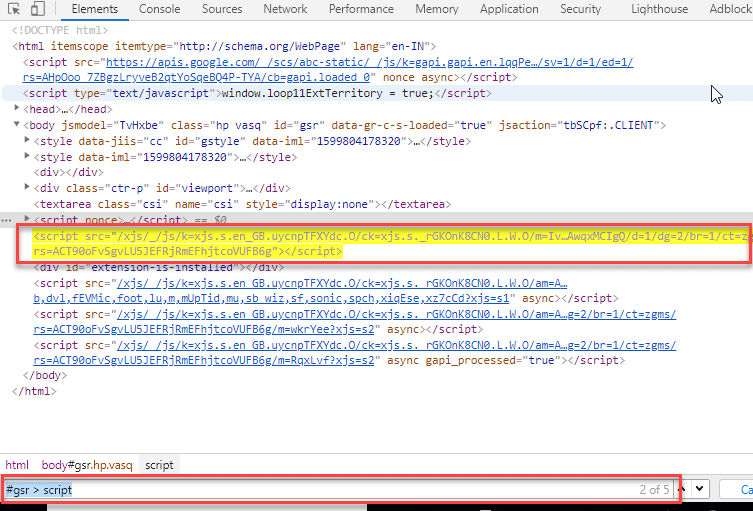
Here we have provided the CSS selector as "#gsr > script", and as you can see, it highlights the <script> tag.
Note: To know more about CSS selectors, you can refer to the article "CSS Selectors".
Locate an element by XPath
We can also specify XPath as a search string to the "find " tool. When we give a valid XPath, the find tool searches the appropriate node for us. Note that we can also retrieve XPath for a particular element using the Copy option, as shown above. Consequently, consider the following image.
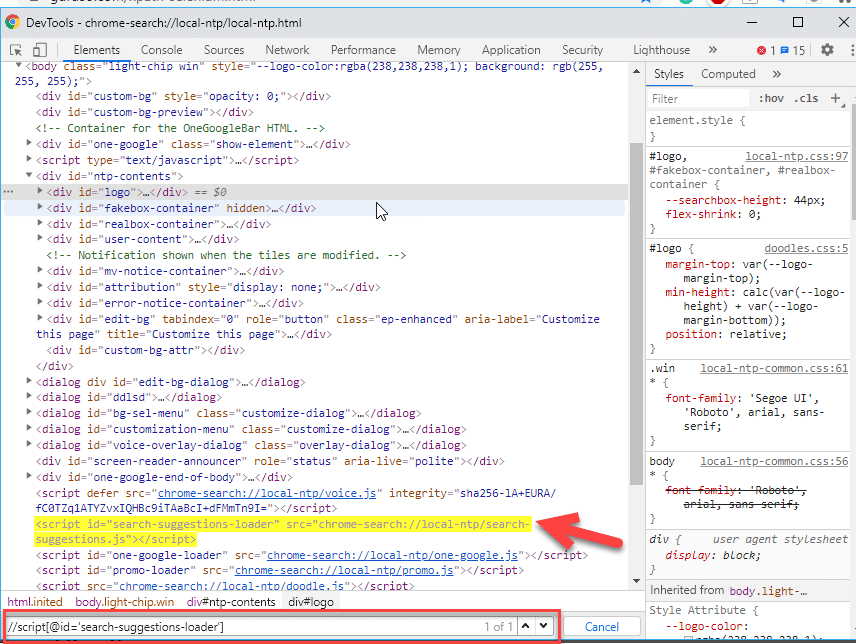
In the above example, we have specified the XPath as:
//script[@id='search-suggestions-loader']
The above expression indicates we are looking for a node 'script ' with the given id attribute value. As shown in the image, the find tool highlights the result obtained (pointed by the red-colored arrow). So this way, we can make use of the find tool in the DOM panel to search a node and inspect it to design our webpages efficiently.
Note: To know more about Xpath, you can refer to the article "XPath in Selenium".
Key TakeAways
- Google Chrome provides a beneficial Developer Tools option, which is very handy for any run time debugging and inspecting any of the elements.
- The first approach is to select an element that we need to inspect and then click right-click and select inspect. It displays the DOM panel with the selected element highlighted.
- The second approach is to open the DOM panel and select a particular element we need to inspect.
- Finally, the third approach is to use the find tool in the DOM panel. We can specify a string, CSS selector, or XPath as search criteria for the find tool, and it will provide us relevant results.