

In the last tutorial about cross-browser testing with LambdaTest, we learnt about the cross-browser testing and how it has helped the developers in recent times to develop great websites in less cost and time. The testing of these websites has been made easy on different browsers and OS by online tools like LambdaTest. We also got introduced to the LambdaTest tool and got a brief introduction to it. In this tutorial, we will walk through the tool and get familiar to it.
Signing Up to LambdaTest
To use LambdaTest and perform the testing of your web application, you first have to sign up for the same.
-
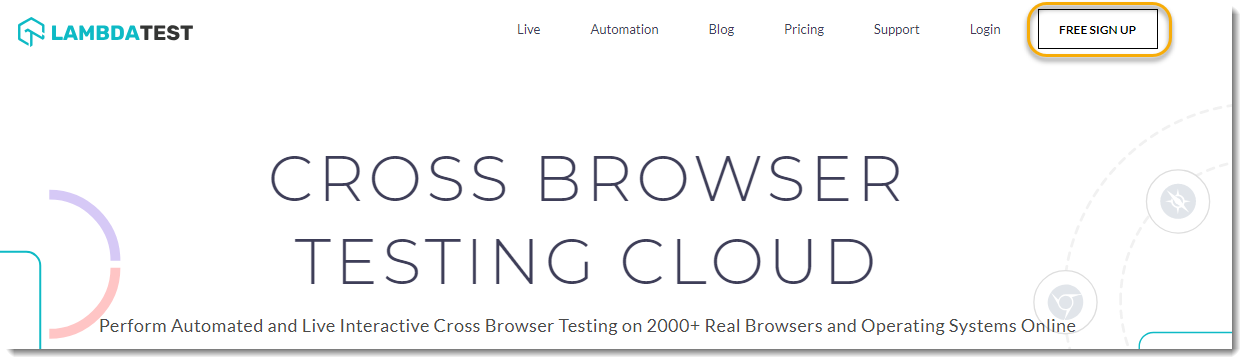
Go to LambdaTest.
-
Select the option to Free Sign Up in the top right corner of the home page.
-
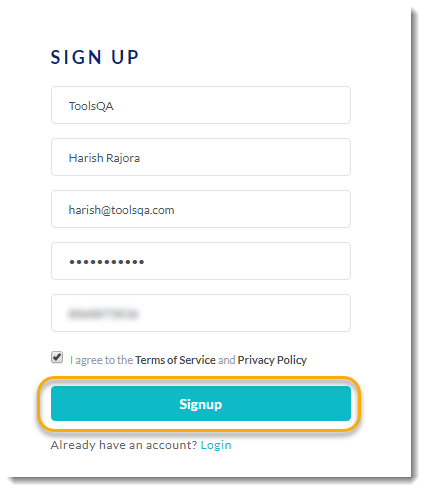
Fill Up your details in the sign-up form and press SignUp.
-
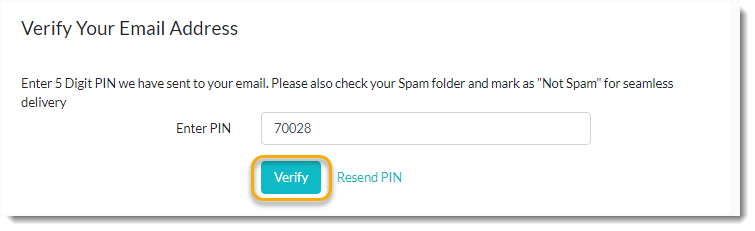
Verify your email address by typing the pin sent to your email address. Then press Verify.
As you press verify, you will be signed up and the account will be created for you. Once all this is done, your personal dashboard will open up.
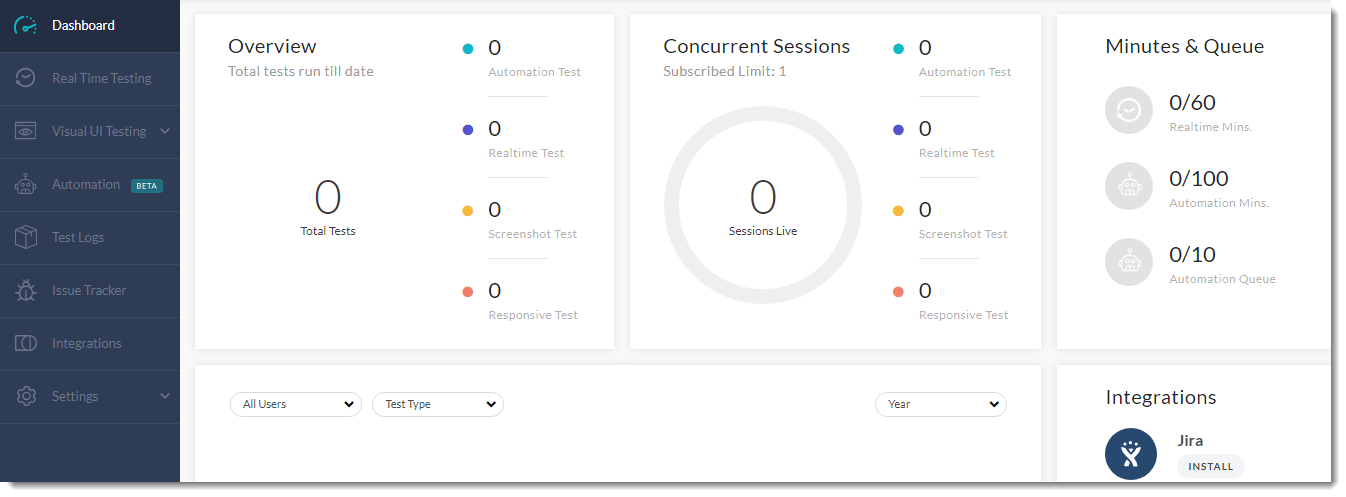 This is your main dashboard and will give you the overall summary of the performance and tests you have executed. Let's see what these different sections in the dashboard mean.
LambdaTest Dashboard
The dashboard here shows the summary and reports of the overall test executions you have done stretched with multiple parameters. The dashboard is divided into multiple sections so that you can see what you want to in just a single view rather than switching the tabs. These sections are explained below.
Overview
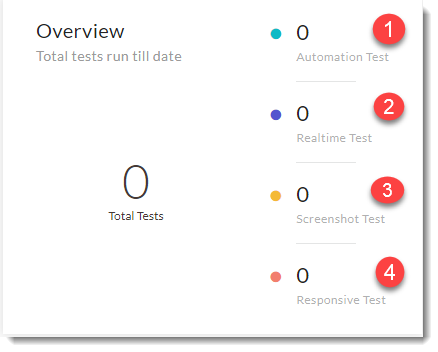
Overview section contains four different count parameters along with one showing the total tests. Total test shows the count of total tests that you have performed. Other parameters will be detailed when we perform testing but to get you familiar they are briefed below.
Automation test
Automation test section is the count of the number of automation tests you have done. Automation tests are different than the manual tests and is the new feature introduced by LambdaTest. We will discuss automation testing in the automation tutorial.
Realtime Test
Realtime tests come under the manual testing pool and the tests are done in real time. Real time testing is called real time here because you can interact with your website while you are testing it. You can do so by entering your url and the browsers on which you want to test. In real time testing, you can do various tasks by launching the VM such as recording the videos and marking something as a bug just to name a few.
Screenshot Test
Screenshot testing section shows the count of screenshot tests done by you or your team. The screenshot test lets you capture bulk screenshots from various devices and various browsers by selecting them all at once. This lets you see the web application at different browsers and versions simultaneously. You can capture up to 25 screenshots in a single go.
Responsive Test
As the name suggests here, a responsive test in LambdaTest tests the responsiveness of the web application. Since the screen size of every device is not the same on which your website will be opened, responsiveness is the key factor to gather a good user base. By testing the responsiveness, you can see how your website is going to be seen as the display of the device changes its screen ratio size. In LambdaTest, you can test for responsive web design through 44 different devices in a single go.
Concurrent Sessions
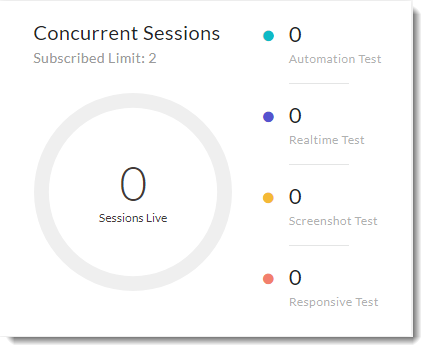
Concurrent sessions in this dashboard represent the sessions that are being simultaneously performed. For example, if you and your team member are performing the tests simultaneously then they come under concurrent session. The number of concurrent sessions depends on the plan you have purchased. My plan allows me to have 2 concurrent sessions so I and my one teammate can perform the test execution simultaneously. The price in every plan increases according to the number of concurrent sessions. You can also perform the concurrent sessions yourself in multiple tabs but that way you will compromise the bandwidth of your network and the test execution will slow down which in turn will increase the overall time of execution and this will trouble you in assessing the test.
Minutes & Queue
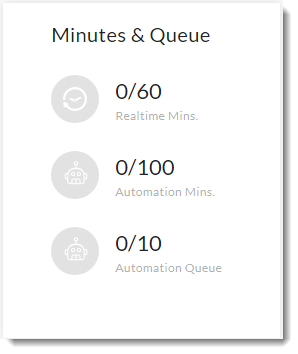
Minutes and Queue is the section which will display you the remaining/spent minutes in the testing department. Both the departments viz. real time testing and automation testing has different criteria. Real time testing is allowed for 60 minutes and 6 sessions of 10 minutes each for a month (free plan). After a month, this meter is reset and you can continue testing. For Automation testing, you are allowed to use just 100 minutes for 15 days, after which the meter is reset. You must know here that these minutes depends on the plan you choose. Since here we are using the free plan, we will be getting the most basic limit as I discussed. For more details, you can visit here about the plans.
Automation queue defines the number of tests you can put inside the queue so that they are run one after the other as they complete.
Graph Summary
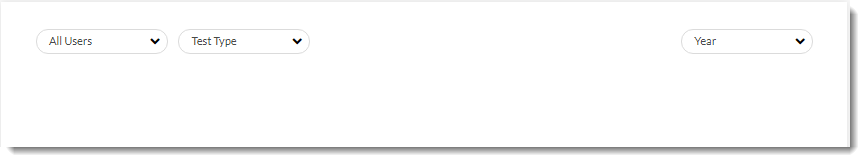 The graph summary box below the overview section shows you the summary of the tests you executed in a graphical manner so that you can analyse the range in an instance. It is a very helpful feature when you are seeing the tests executed by you or your team member and according to the test type.
Since we just signed up, there isn't any graph available as of now but let me show you how it looks after running 4 tests.
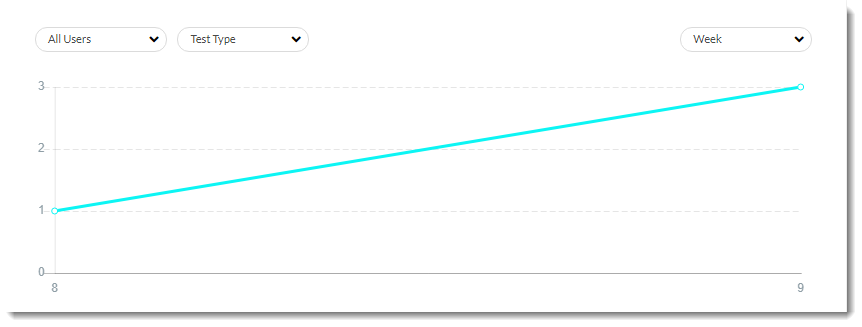
As you can see, I ran 4 tests indicated by "1" and "3" in the graph. The x-axis in the graph is according to the right-most drop down which says "week". Therefore the x-axis of the graph represents that 1 test was run on 8th week and 3 were run in the 9th week of the year. Let see how it changes when I change it to "Month".
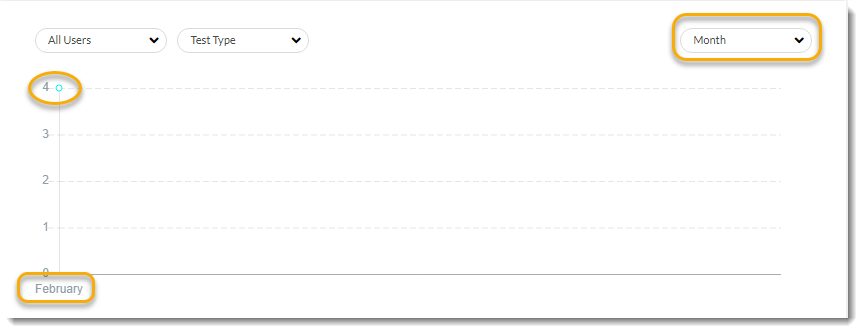
As you can see, in the month of February, I executed 4 tests. This option is very useful when you need to see the intensity of the execution of your tests according to Days, Weeks, Months or Year.
You can also choose the type of test from the "Test Type" dropdown as shown below
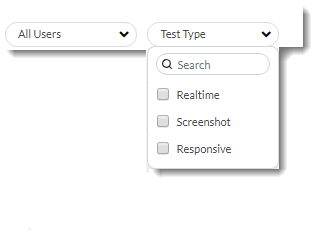
From this dropdown, you can select the type of test so that the same test summary is shown in the graph. If there is no checkbox selected then you will be shown all the tests' summary.
Integrations
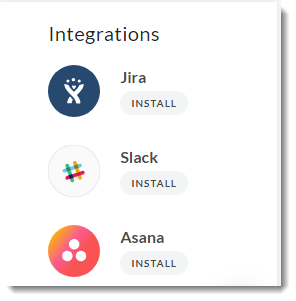
Integrations in LambdaTest is one of the most unique and important features that an online cross-browser testing tool can have. In LambdaTest you can easily integrate to the third-party applications. The type of integration you would be doing totally depends upon the application you are integrating to. For example, if you are integrating to Jira, then you will create the issues directly in Jira through integration. If you are integration to Slack, then you will be pushing a bug directly to your slack channel through integration. This way you can integrate to any third party applications and there are many available for your use which we will discuss later in this course.
I hope you have now understood this tool and got familiar with it. We are now ready to use it and execute our first real-time test in the next tutorial.